Resources
CppCon 2015: Greg Law ‘Give me 15 minutes & I’ll change your view of GDB’
GDB is not easy to learn, but it is easy to use once you discover what commands exist and what you can do with them. In this cppcon talk from a few years ago, I shared some of the neat things you can do with GDB that you might not have uncovered yet.
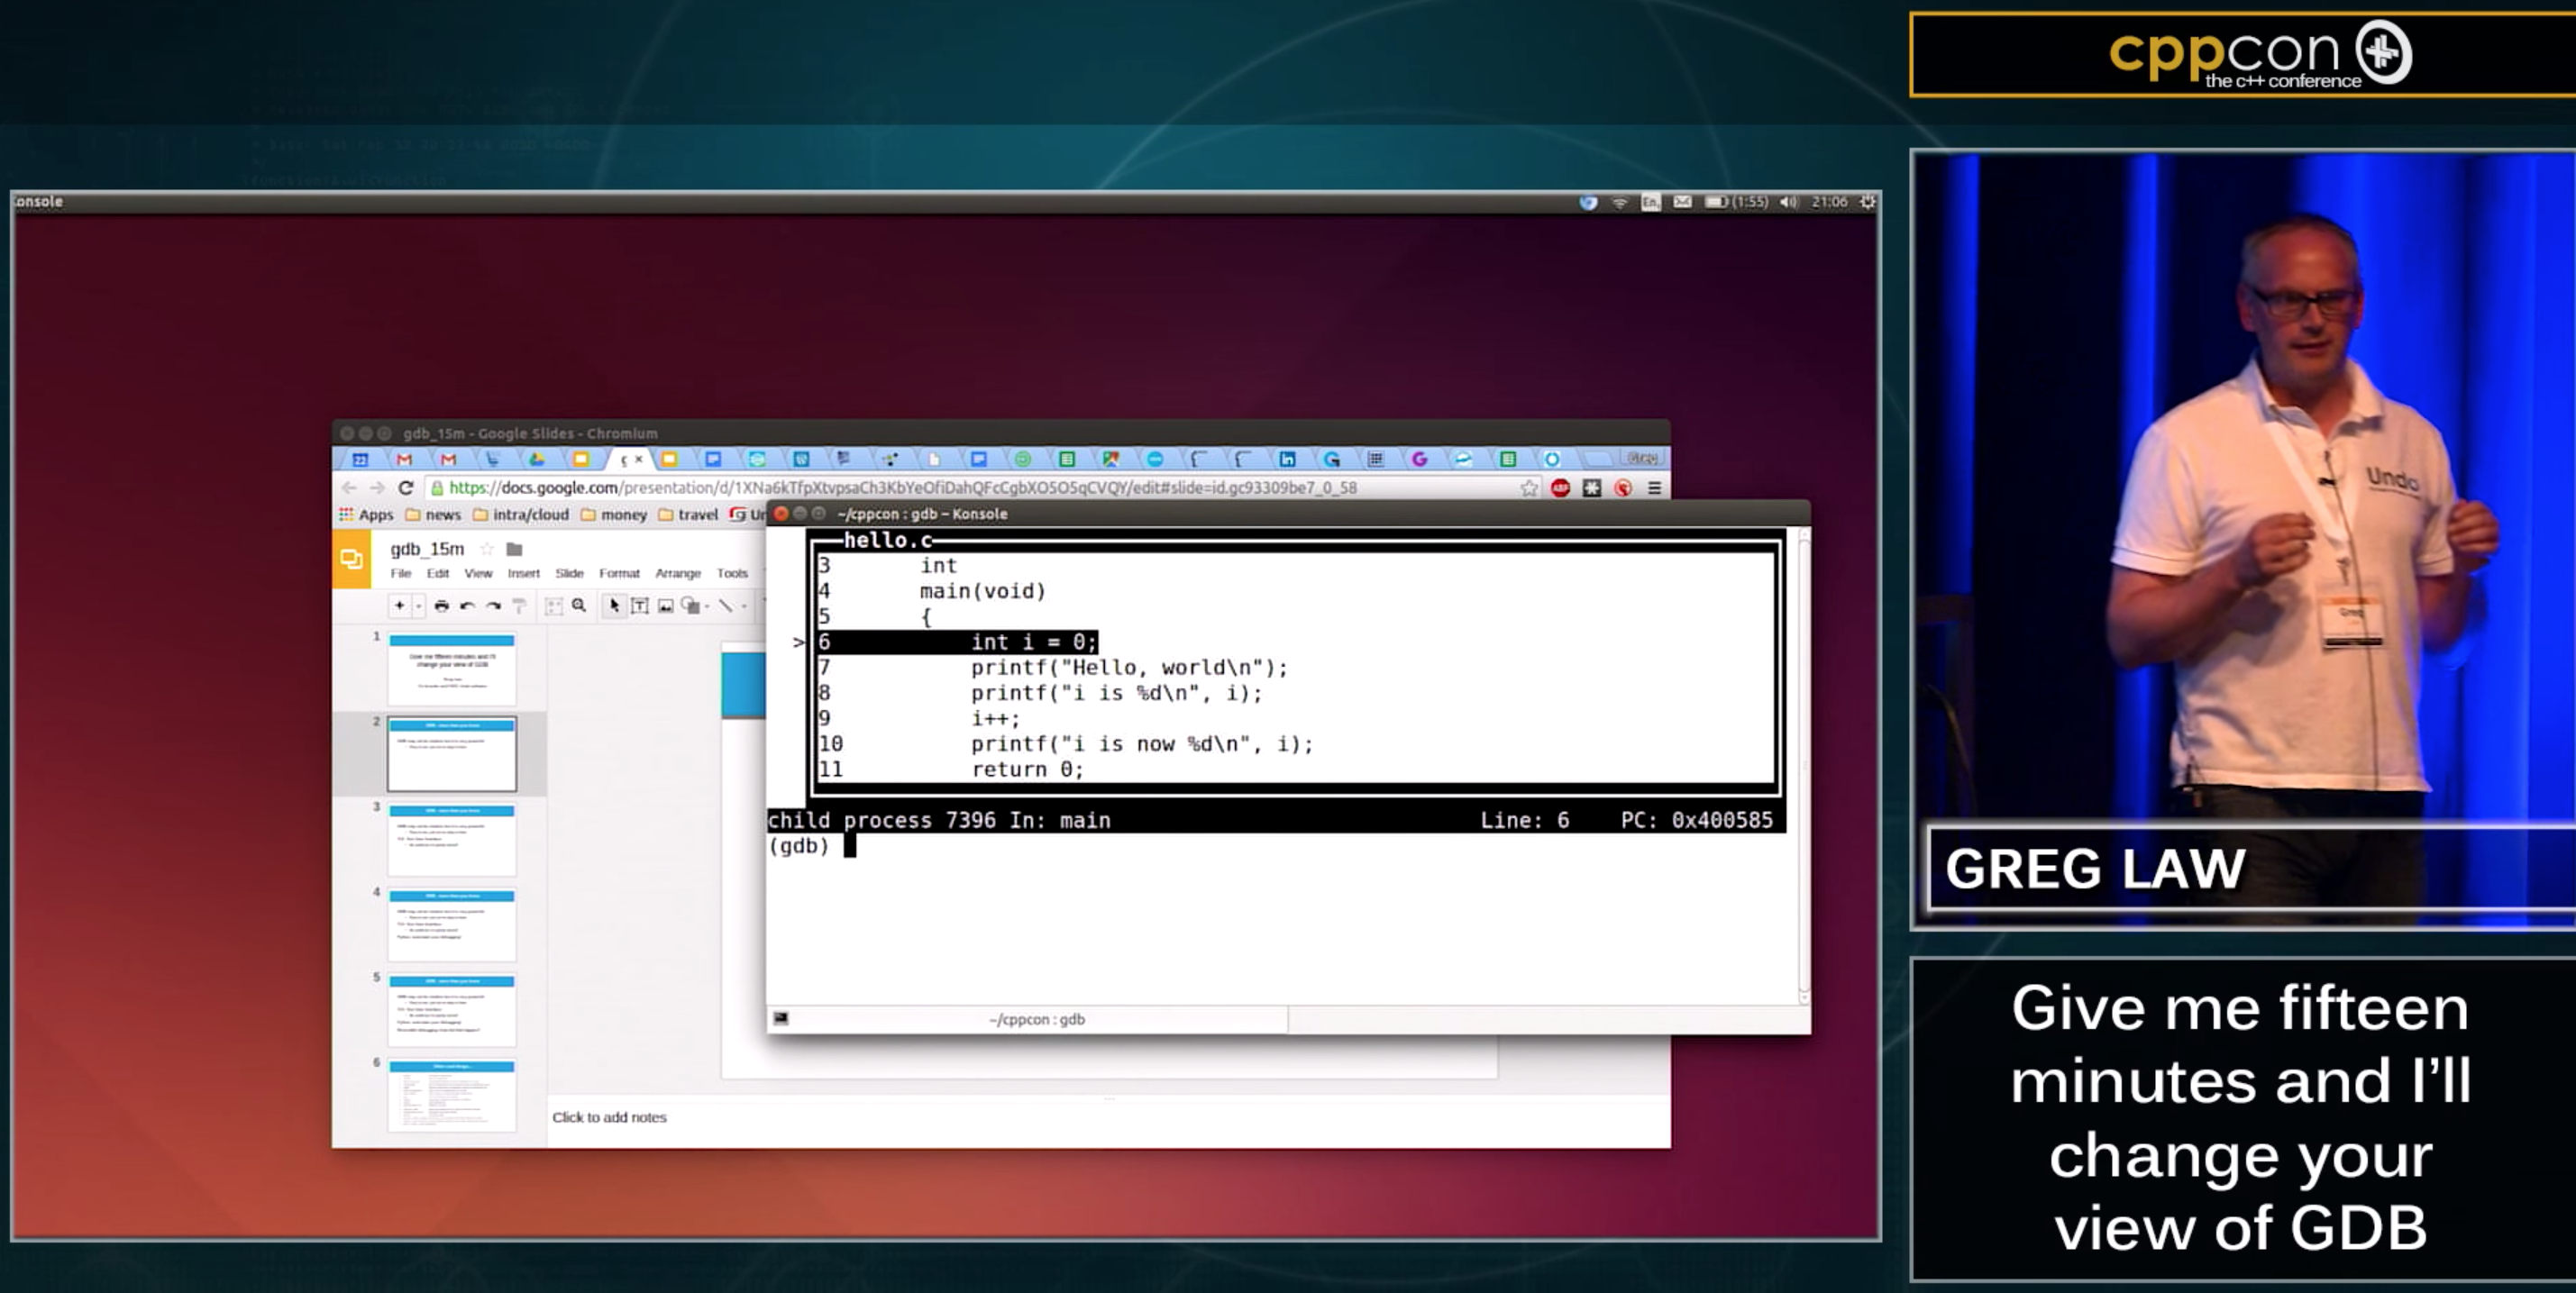
To start with, I took a typical “Hello, world” program, compiled it and explored what GDB can do for you. Starting with the thing which is least known and most powerful: TUI mode. That is, Text User Interface mode.
TUI (Text User Interface) Mode
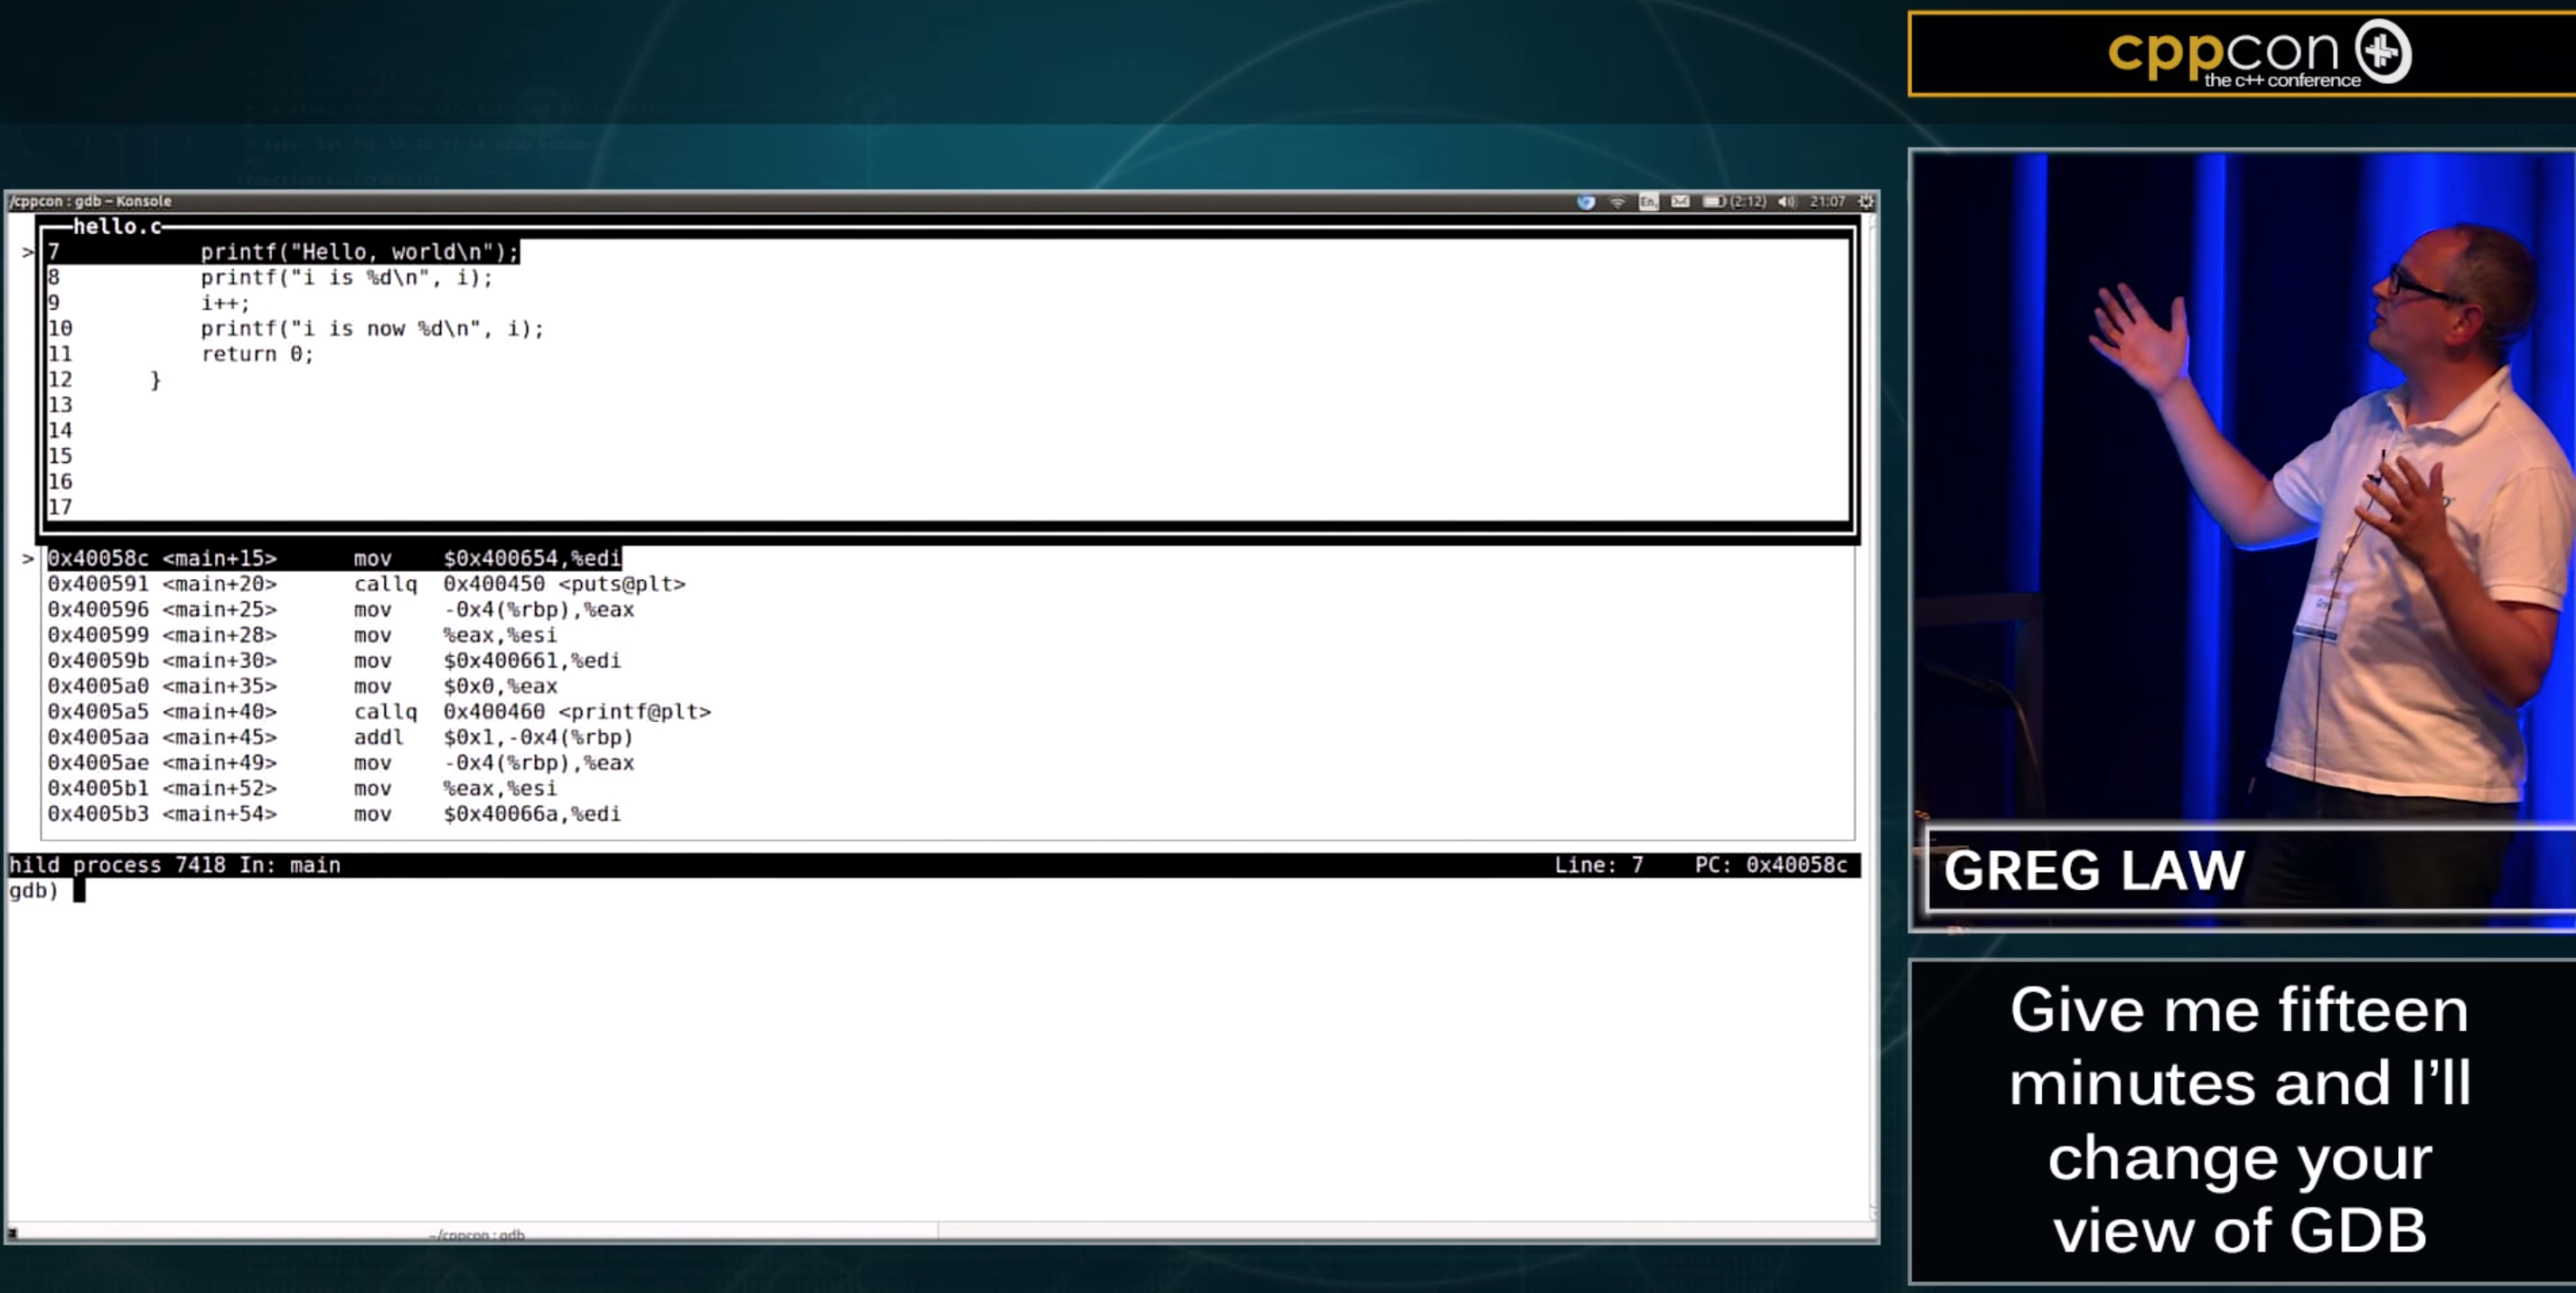
TUI mode is worth exploring. With TUI mode, it’s much easier to see exactly where you are in the program you’re debugging. Rather than seeing only one line at a time, you can see a chunk of your program all together – providing you with much needed context.
To get into TUI mode, you type ctrl-x-a after which you’ll see something like this:
Before going further, it’s worth knowing how to deal with TUI mode when it messes up. Sometimes TUI prints text over the (very 1980s!) graphical layout which makes the screen somewhat unreadable. When this happens, hit ctrl-L to have it re-paint the screen and everything should look ok again.
Another quick tip is to use ctrl-x-2 which allows you to cycle through showing windows with your assembly and your registers, as well as just the source code:
A last tip for TUI mode is to know that it hijacks the normal up- and down-arrow commands which would typically get the previous comments. To get the previous/next command behaviour, you need to use ctrl-p for the previous command and ctrl-n for the next (having already gone ‘previous’ a few times).
Scripting with Python in GDB
Debugging can involve doing a lot of the same steps again and again, so it’s worth knowing that you can script using a python interpreter which is built into GDB. This is very powerful when you realise you can begin to script your debugging.
Prove it to yourself with:
(gdb) python print(“Hello, World”)This just shows that I have python available, but if you start a little scripting you can see the potential to speed up your debugging:
(gdb) python
import os
print (“my pid is %s” % os.getpid())
You can use the python interpreter inside GDB to create functions which can then become first class GDB commands, which is cool. You can easily imagine creating helper functions for steps you repeat often, or for navigating specific data structures or details of the debugging to make your life easier.
Python can see GDB
The python intepreter is tightly bound to GDB itself so it can “see” the GDB environment from python through the gdb. library. So, for example, if I have a couple of breakpoints already set up in GDB, then I can do the following and see that the python interpreter is aware of them:
python print(gdb.breakpoints())I can then dig into the details of one of them:
python print(gdb.breakpoints()[0].location)Or you can even set breakpoints in python:
python gdb.Breakpoint(‘7’)With this, you can find out information about the source file, about local variables and you can setup python pretty printers to make the output more humanly parsable. Again, you can quickly see how being able to script your debugging with python will make your debugging life easier.
GDB reversible debugging
Of course, UB (previously known as UndoDB) is quicker and more awesome, but GDB has its own reversible-debugger which you should know about.
In the talk, I took a bubble sort algorithm which just happened to have an intermitent bug and used GDB’s reversible-debugger to find the problem line. As with any intermittent bug, running this in a loop enough times eventually allows the intermittent bug to show up, which in this case it does at a segfault.
However, debugging this segfault bug is hard. Despite the process creating a core dump, it was clearly a stack smashing bug and the core dump had nothing useful for my to see. This is where we can use GDB.
I started by running GDB on the program:
$ gdb o.out..and we then enable reversible-debugging so that when it faults, I can step back a bit and get the context of where and how the bug occurred. But we have a problem: it isn’t predictable when the program will fault because the bug is intermitent, so I have to run it a bunch of times which is tedious. Using GDB features I can make my life easier…
To help with this, I created breakpoints in a couple of places and then using another cool feature of GDB I can issue commands when the breakpoints are hit.
First, I setup a breakpoint (3 in the example below) where the program exits successfully, i.e. without error which is uninteresting to us. To do this I do:
(gdb) command 3Type commands for breakpoint(s) 1, one per line.End with a line saying just "end".runend
I then created another breakpoint for when things go wrong. If this happens, I want recording to start (so I can do reversible debugging) and then continue:
(gdb) command 2
Type commands for breakpoint(s) 1, one per line.
End with a line saying just "end".
record
continue
end
When I run this, each time the program exits successfully it just tries again until it fails. When it does fail with the segfault error I am in GDB and able to look around so I can just reverse-step i and then I’m back into a sensible stack which I can inspect and understand.
I can then inspect the stack, set an appropriate watchpoint and use reverse-continue to find out at what point the location in memory is changed so I can find the offending part of the code. At this point I can explore the local variables and find out what happen.
To reiterate what I’ve done: by using a couple of features of GDB I took an impenetrable bug with no useful coredump and made it so I can dig into the moment the error occurs.
Watch the video for a more tips.


